Waves Module 2
Table of contents
 Activity 1
The top view diagram at right shows two point sources of sinusoidal waves. The waves travel outward in the horizontal plane away from both sources. Consider a point in the horizontal plane of the two sources. If the distance of this point from S1 is r1, and the distance of this point from S2 is r2, then we define \(\Delta r = |r_2 - r_1|\).
- Sketch the sources in your notebook. On your diagram, indicate the points for which the value of \(\Delta r\) is (i) largest and (ii) smallest.
- What are the largest and smallest values of \(\Delta r\) for this situation? Explain your reasoning.
Activity 2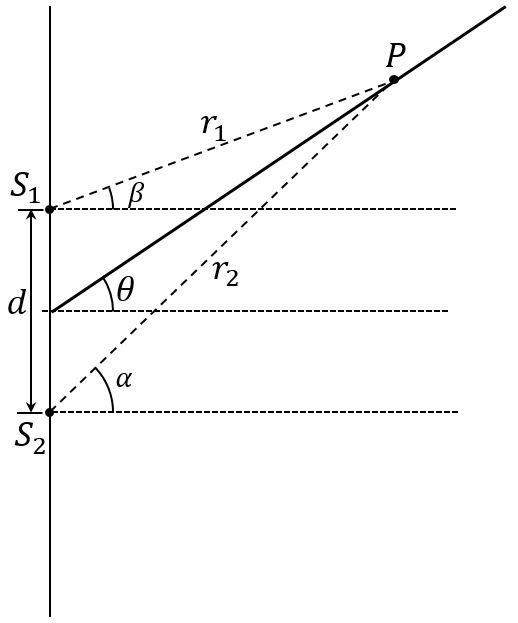
The diagram at the right shows an arbitrary point, point P, that lies near two point sources of sinusoidal waves. The two sources are in phase with each other. In this activity, we consider how the phase difference of the waves arriving at point P changes as point P is moved outward along the dark line, away from the sources.
- How do the angles \(\alpha\), \(\beta\), and \(\theta\) compare?
- Suppose that point P is moved away from the sources along the dark line, so that \(\theta\) is fixed. In the limit that point P is very far from the sources, what values do the angles \(\alpha\) and \(\beta\) approach?
- In your notebook, draw an enlarged diagram of the region around S1 and S2 in case in which point P is very far away. In your diagram, r1 and r2 should be parallel. On your diagram, indicate the line segment that represents how much farther point P is from S2 than it is from S1. Label this distance \(\Delta r\). Determine a relationship between \(\theta\) , \(\Delta r\) , and d.
Activity 3
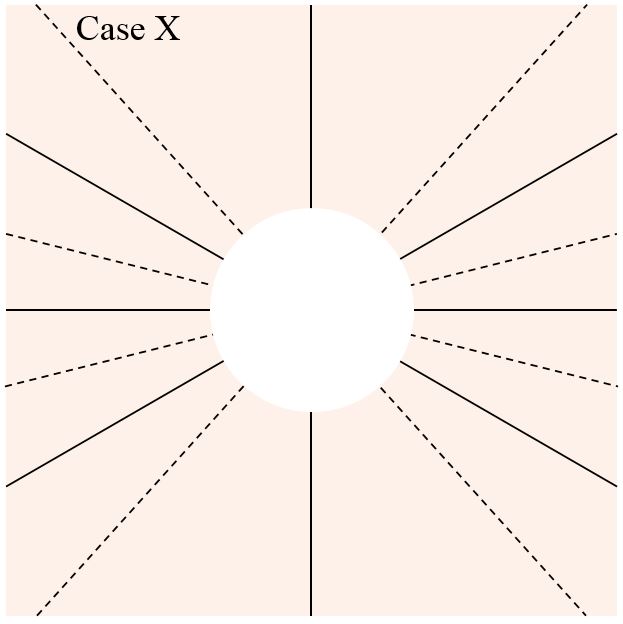
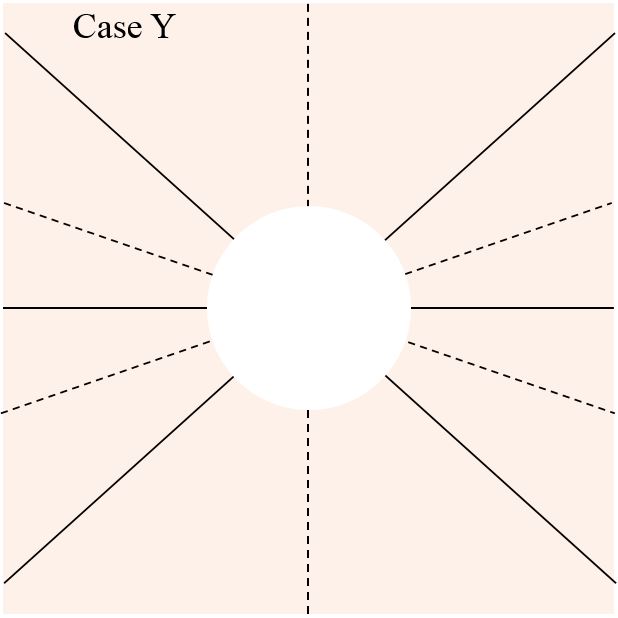
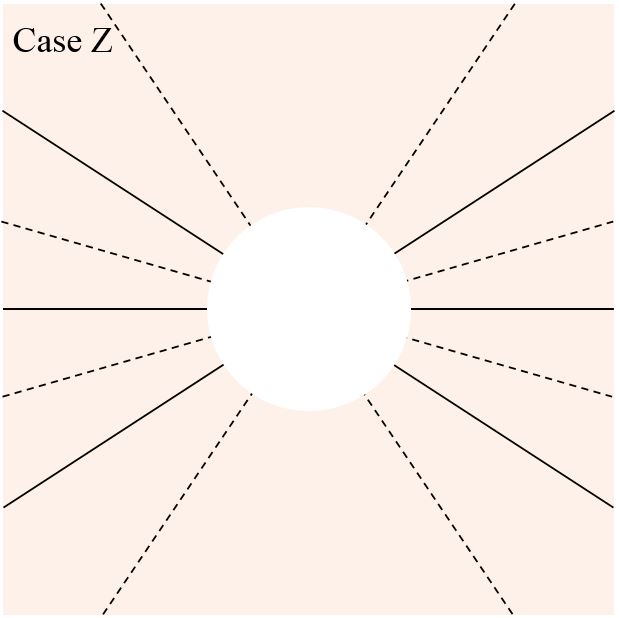
Each of the diagrams below shows all the antinodal lines of constructive interference (solid) and all of the nodal lines of destructive interference (dashed) due to two point sources. Both sources emit sinusoidal waves with the same frequency, wavelength and phase in all directions. The sources, which are not shown, lie along a vertical line near the centre of the white circle.
For each case, determine the source separation, in terms of \(\lambda\). For any case(s) for which it is not possible to determine the source separation exactly, at least try to determine the range into which the source separation must fall. You may find it helpful to first rank the cases by source separation.
Explain how you determined the source separations.
Activity 4
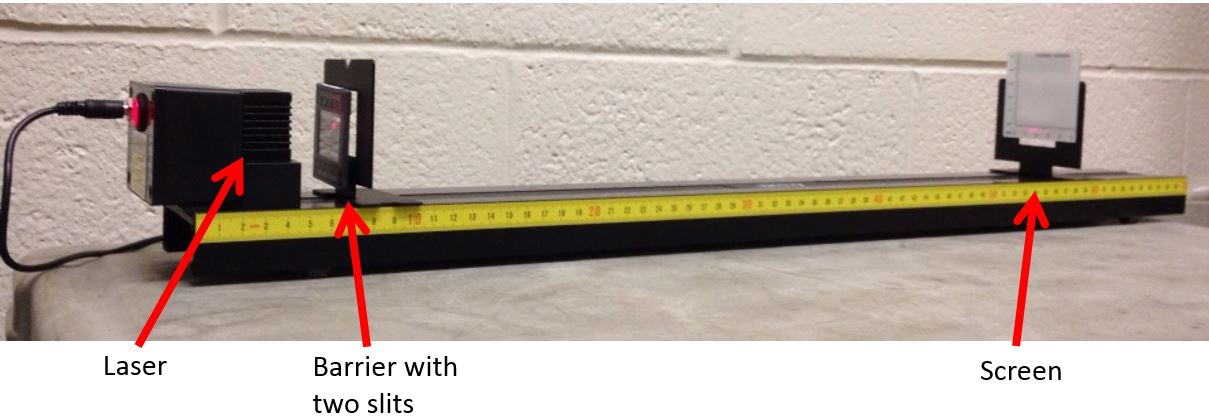
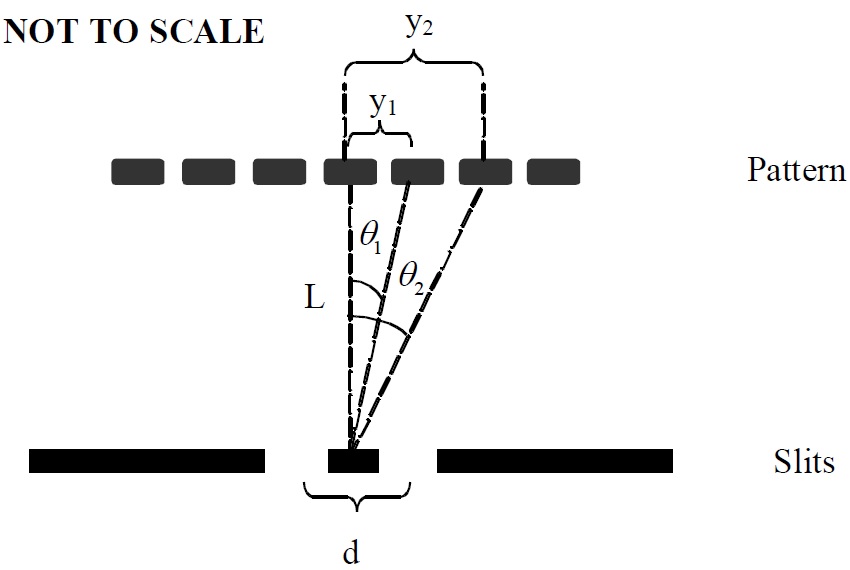
A red laser, a barrier with two identical, very narrow slits, and a screen are arranged as shown below. The drawn diagram (not to scale) is the top-view, as seen from above. The two photographs are taken from the side. The distance between the centres of the slits is d. The laser emits monochromatic, coherent light, which means the photons all have the same frequency and phase. The point P on the screen is aligned with the laser and the centre of the 2-slit pattern. Point P is the centre of the pattern of fringes seen on the screen, and is the position of a bright fringe, representing a maximum in intensity at the screen. Point Q is the adjacent maximum in intensity to the right of P. Point R is the minimum of intensity immediately to the right of point Q.
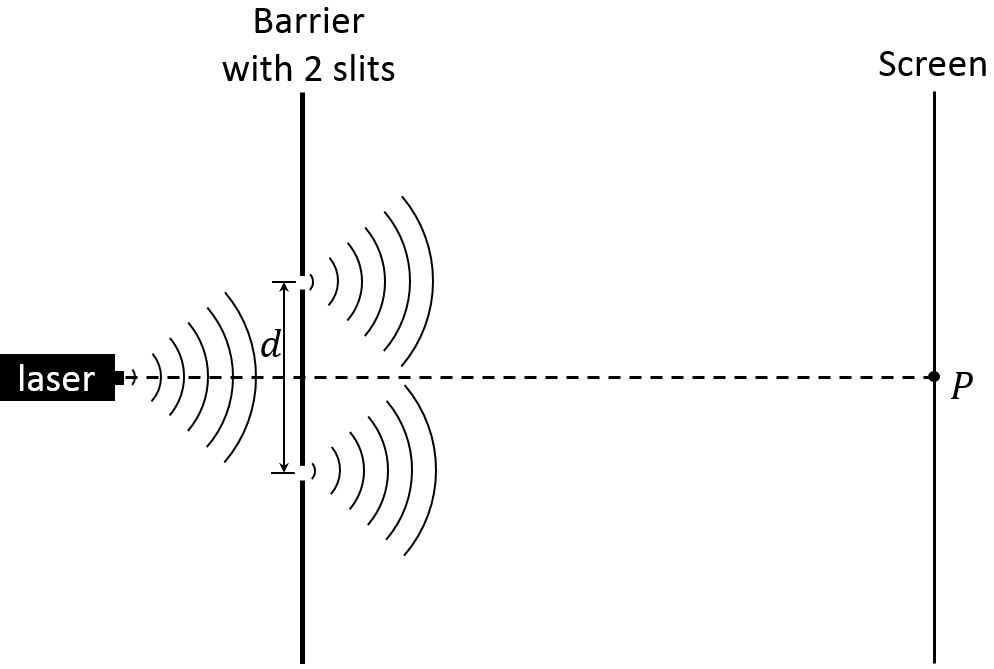
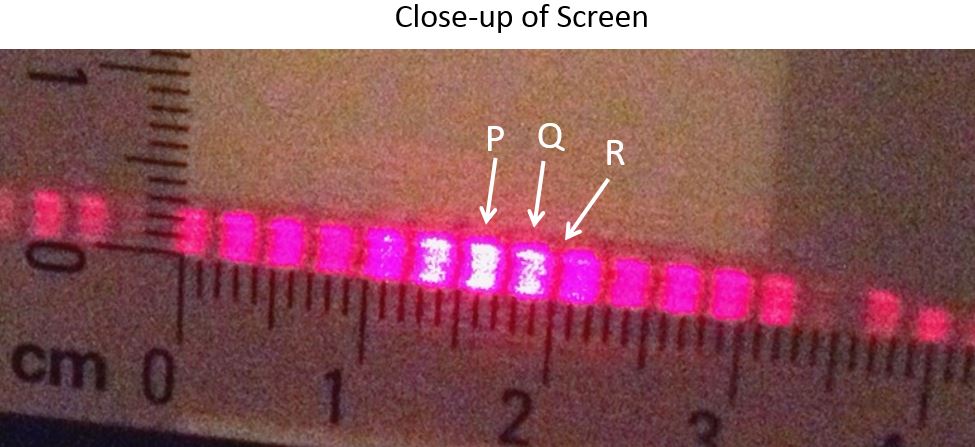
- For light impinging on point P, what is \(\Delta r\), the difference between the path lengths from the two slits? Repeat for point Q and point R. Express each value of \(\Delta r\) in terms of the wavelength \(\lambda\).
- Assume the screen is located 2.2 m away from the slits, and the distance from point P to point R is 1.6 mm. Determine the distance between the slits in terms of \(\lambda\). Show your work and describe any approximations that you make in answering this question.
- Suppose that the width of one of the slits were decreased without changing the distance between the centres of the slits. Would the intensity of each point (P, Q and R) increase, decrease, or stay the same? In each case, explain your reasoning.
 Activity 5: The Single Slit
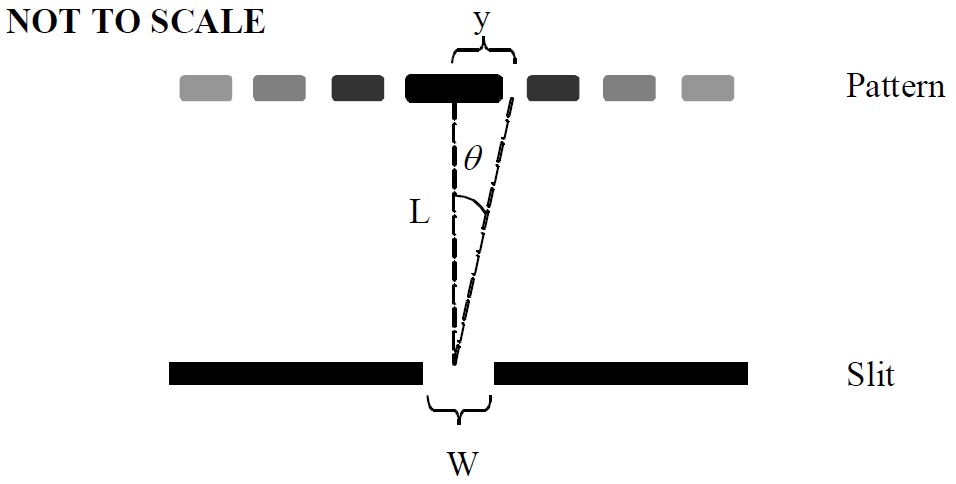
When laser light passes through a small slit, it forms a diffraction pattern of bright and dark fringes (as shown below). The central bright fringe is wider than the others. The angle (\(\theta\)) between the center of the middle bright fringe and the center of the first dark fringe is related to the width (W) of the slit and the wavelength (\(\lambda\)) of the light by \(\sin \theta = \lambda / W\). You can also see from the triangle in the diagram below that \(\sin \theta = y/L\), so these two equations combine to yield: \(\frac{y}{L}=\frac{\lambda}{W}\).
First, you will use the diffraction pattern produced by a laser shining through a slit to determine the laser’s wavelength.
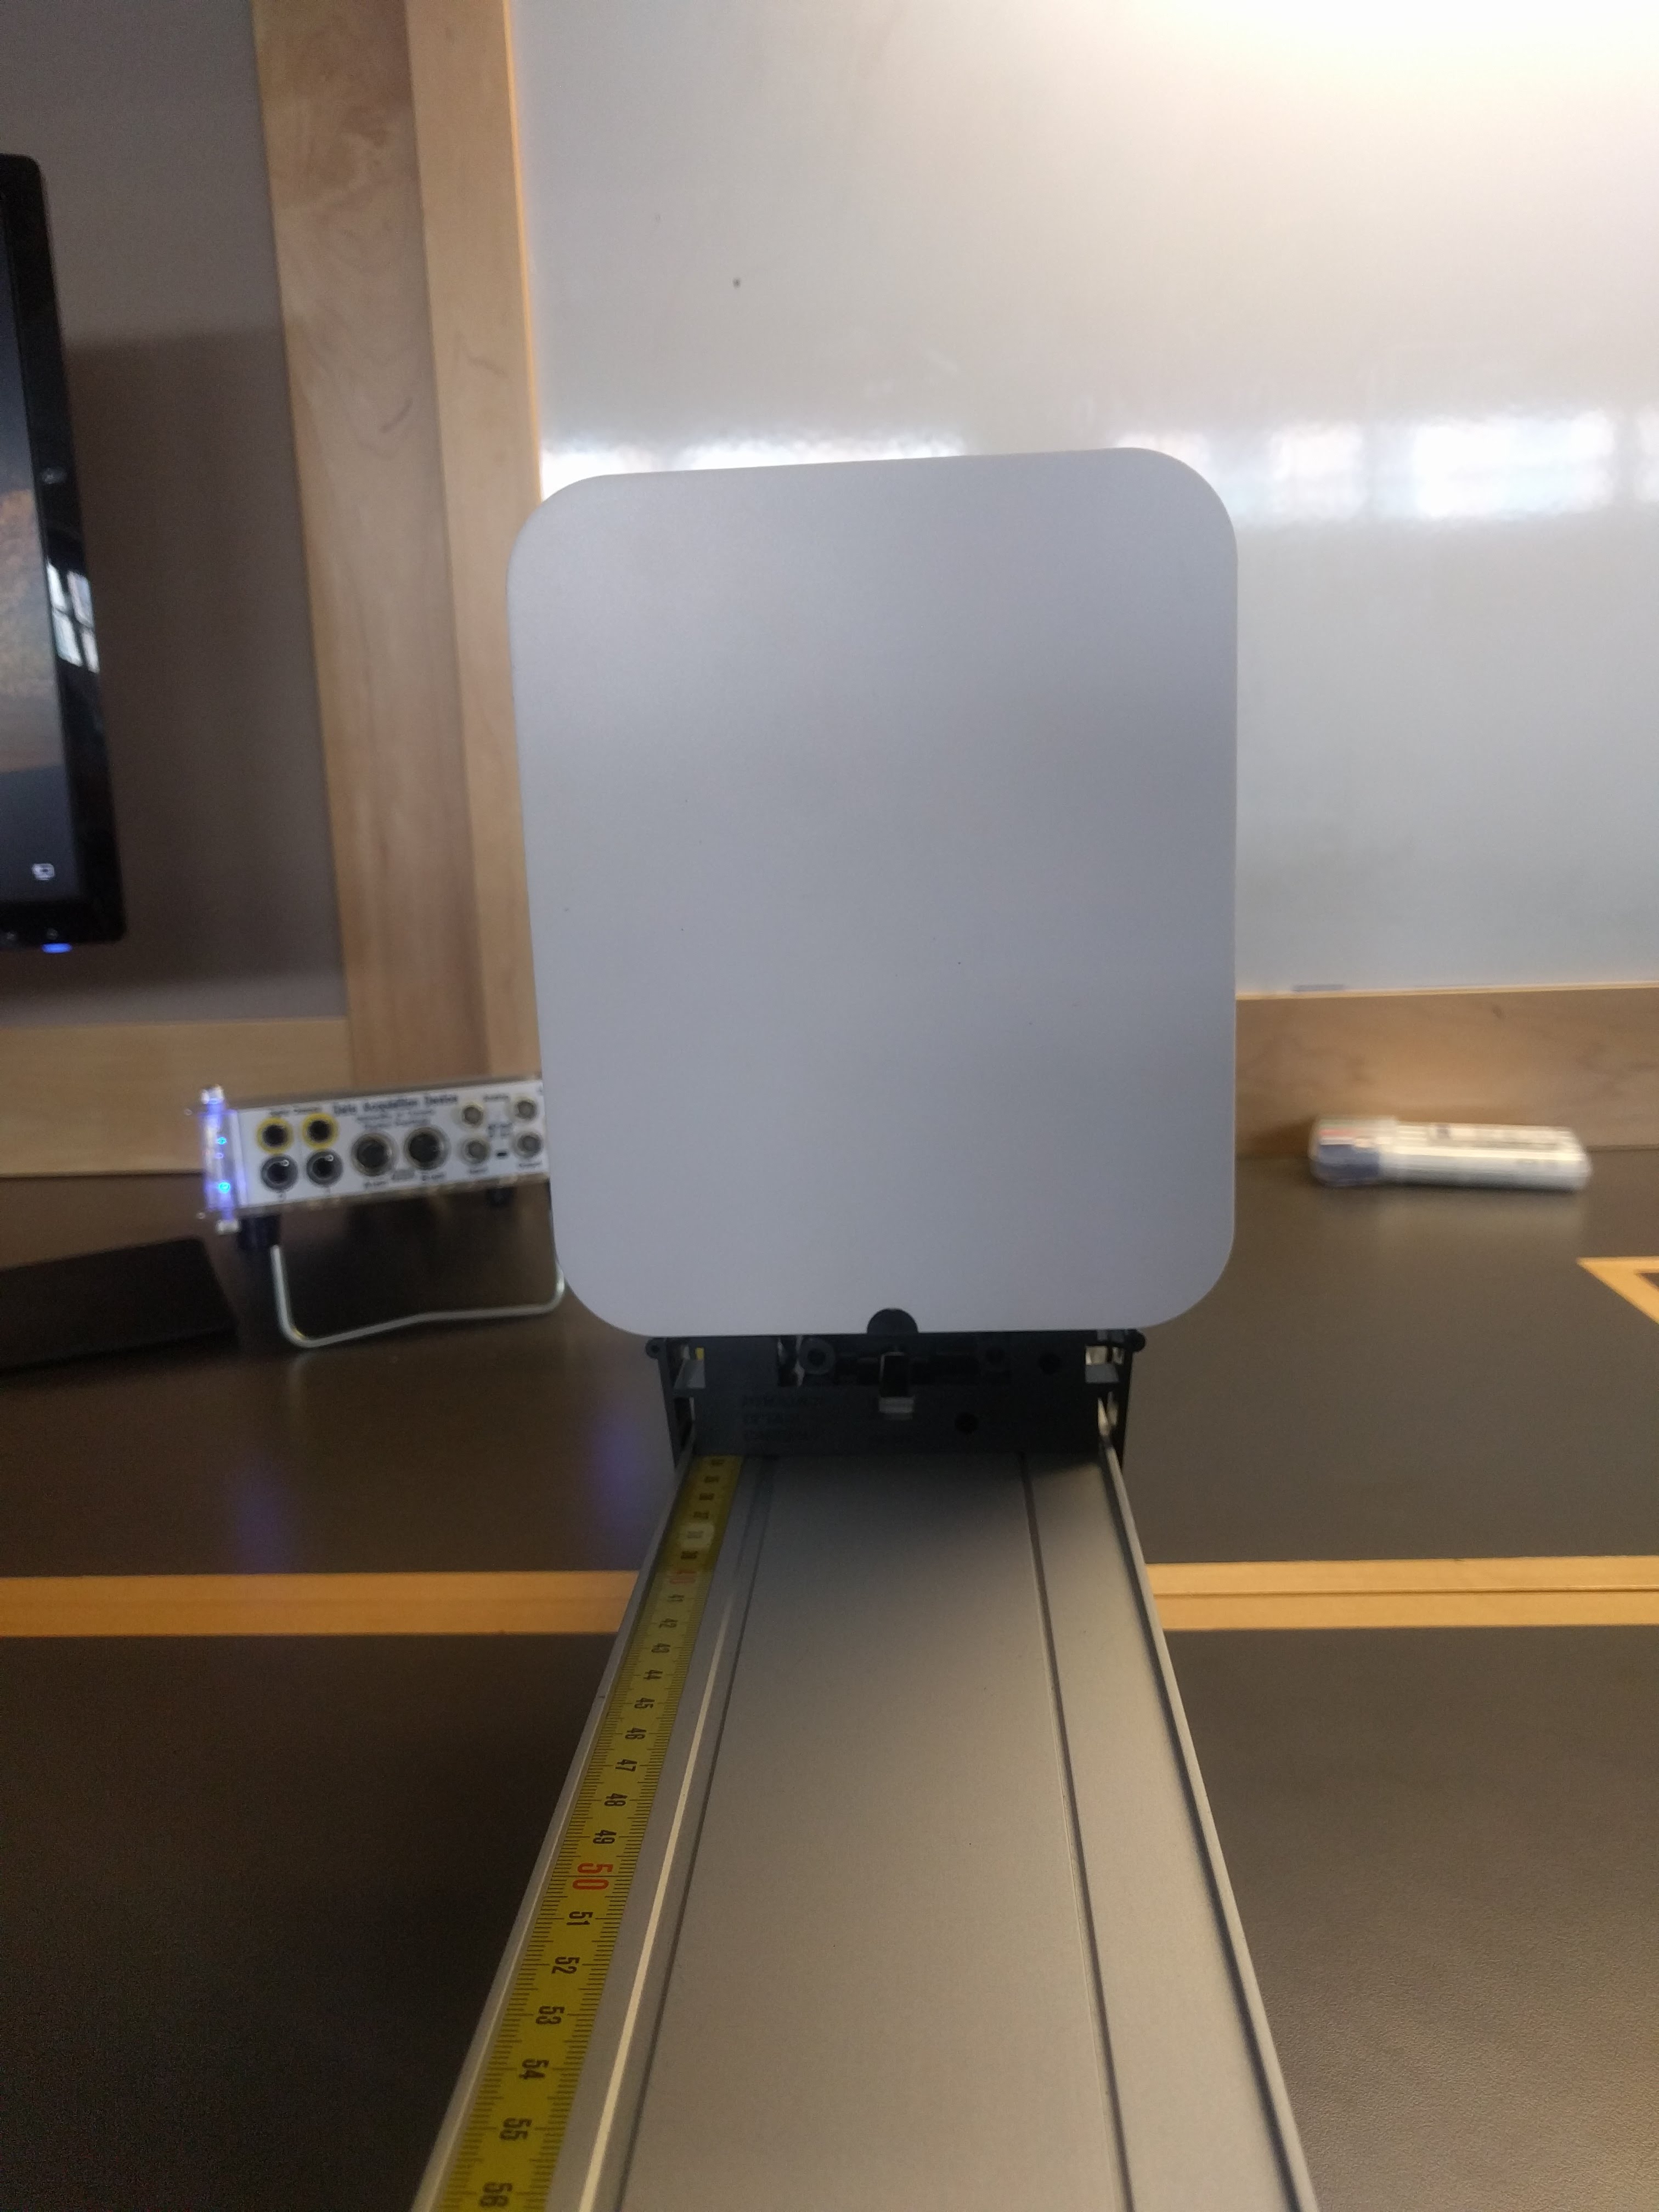
Set-up: In this experiment, you need the white screen, the single slit apparatus, and the laser to be mounted on the track. Each of these has the same bottom, with a piece that can be pinched inwards. You also have 3 bases to mount each onto. For the each of the screen, the single slit apparatus, and the laser, pinch the bottom and slide into the rectangular cut on the mount. The mount can then be snapped onto the track. See the pictures below.
Back of Screen:  Mount + Screen:
Screen in mount: Screen+mount on track:
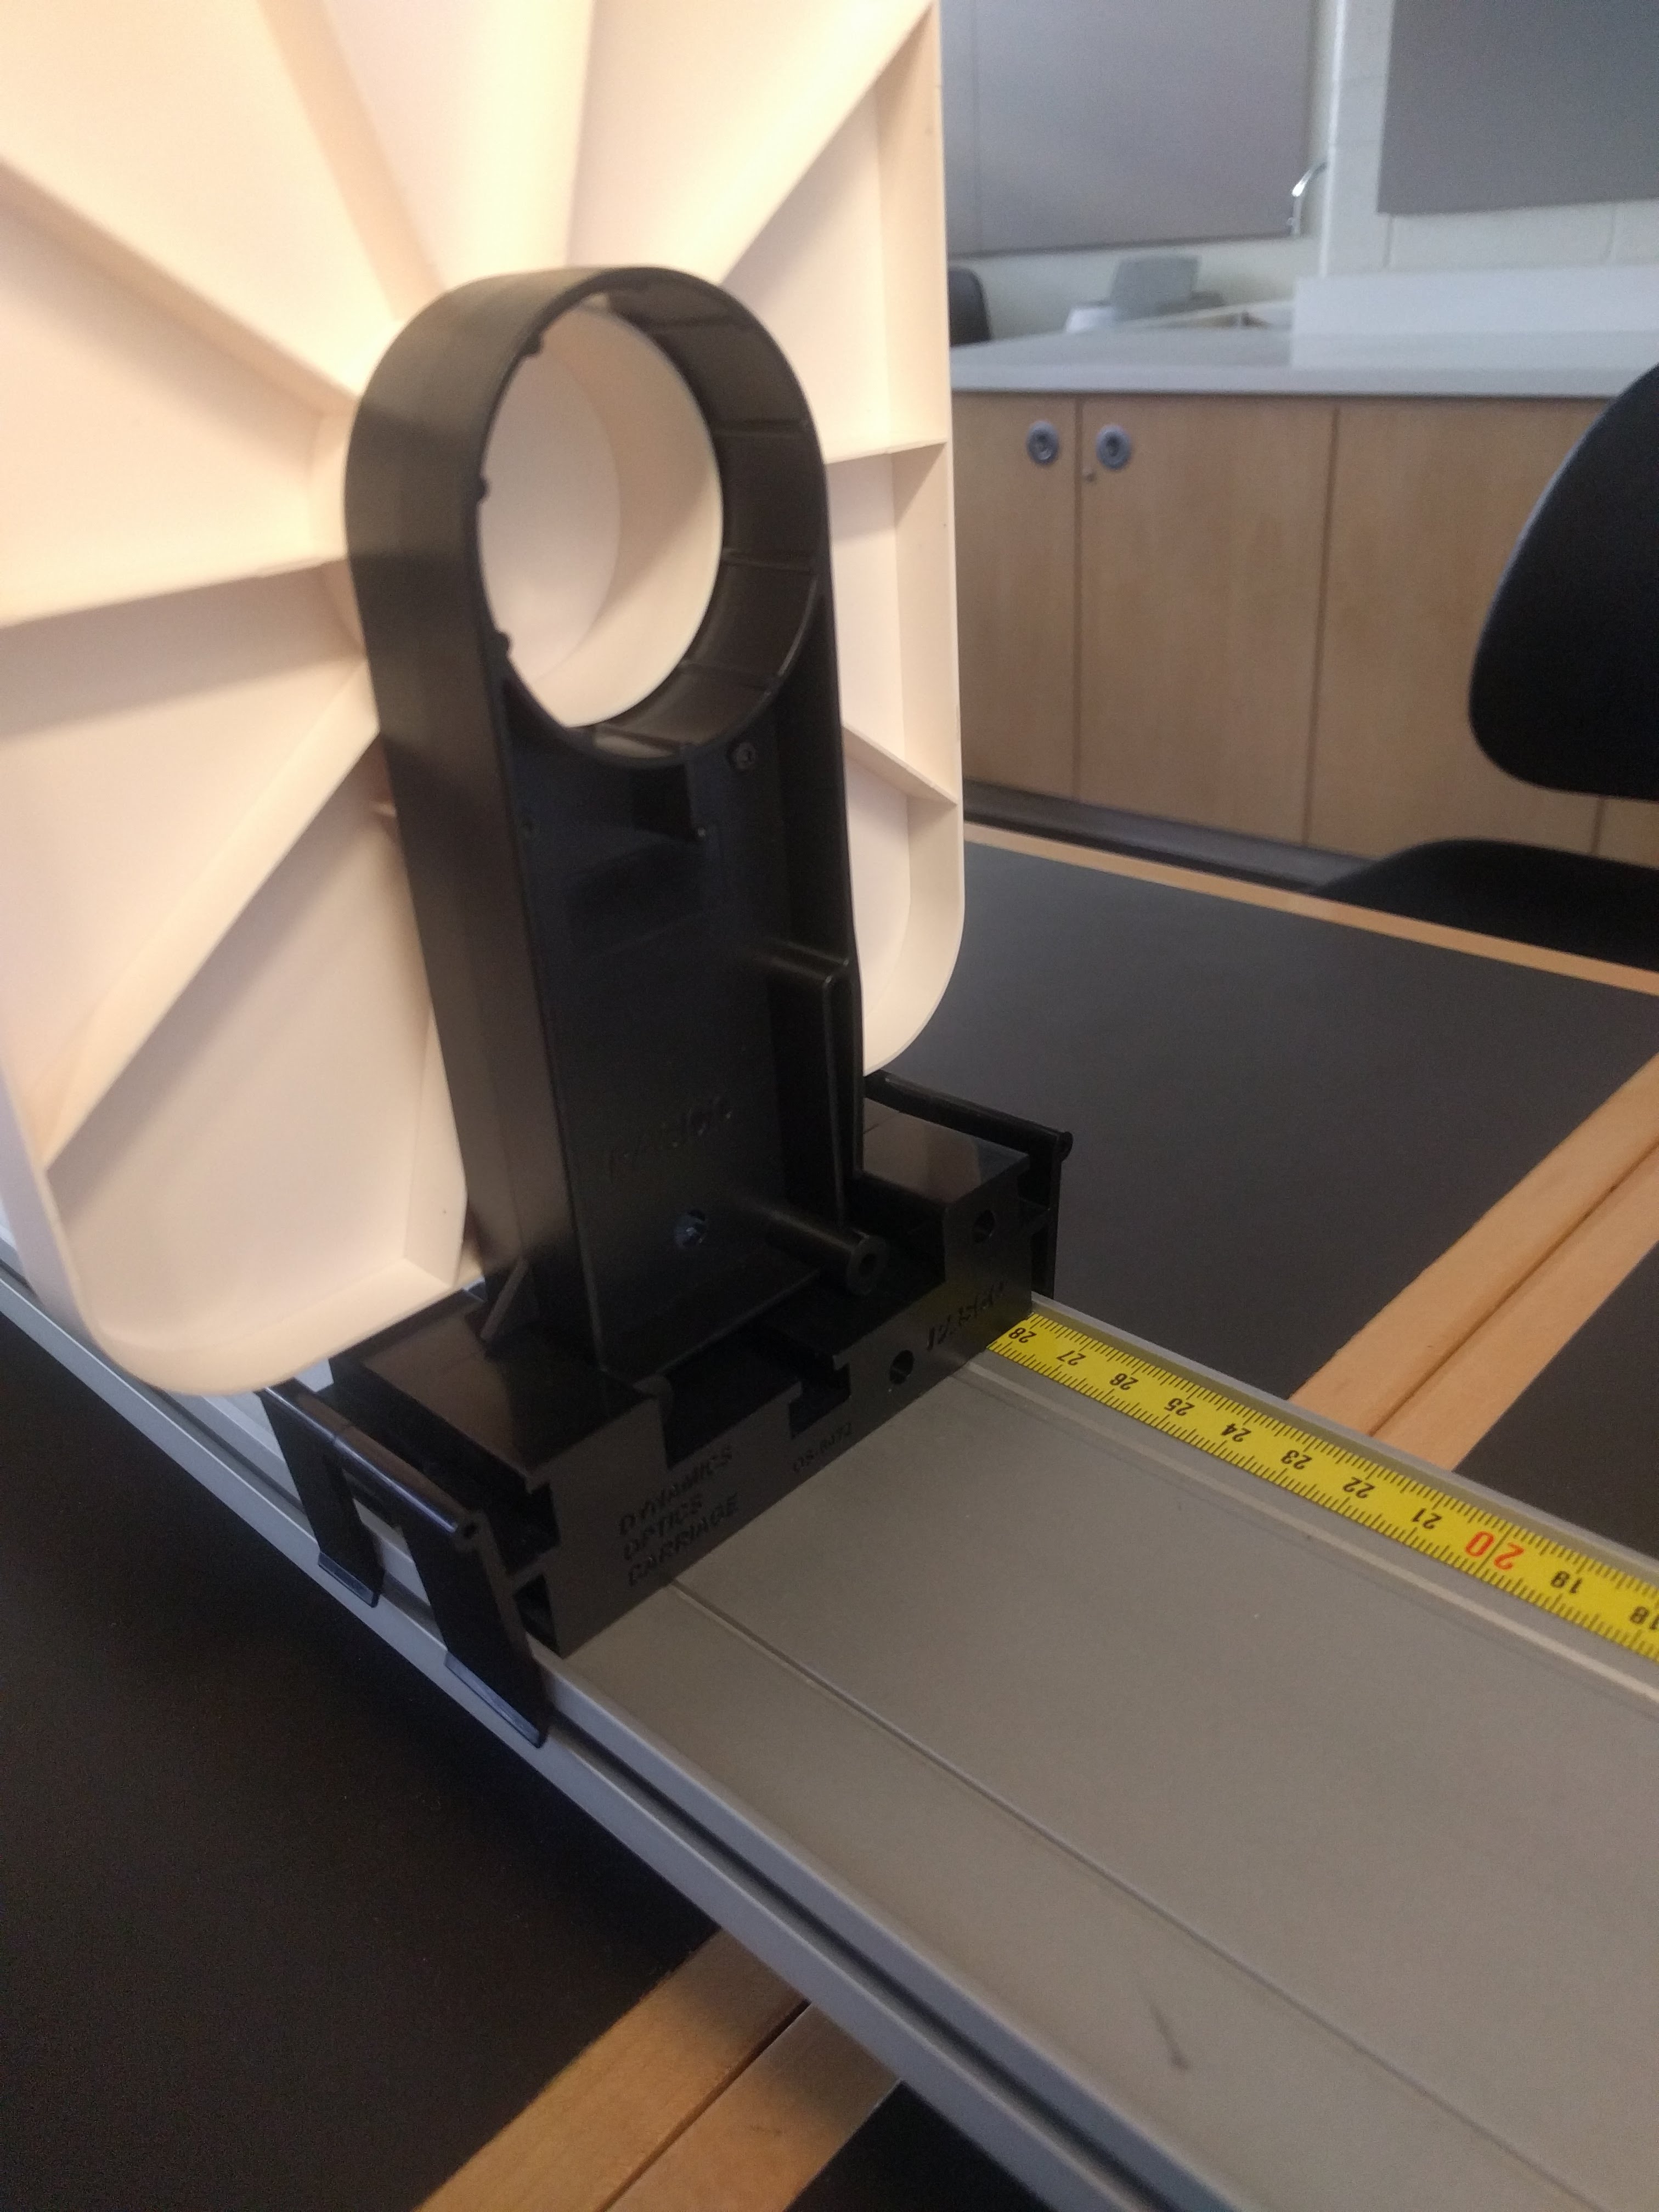
-
Set up the red laser to pass through the widest single slit (W = 0.160 ± 0.005 mm, where the uncertainty comes from the PASCO OS-8453 Manual) and a diffraction pattern appears on the screen. The screen should be about 1.5 meters from the slit. Measure this distance L and its uncertainty. Tape a piece of paper to the screen and sketch the pattern that appears on the screen. This sketch can be taped into your notebook. Mark the middle of the pattern. Determine the distance (y) between the middle of the central bright fringe and the middle of the first dark fringe on one side of the pattern (as shown in the diagram above). It is easier to measure the distance between the centers for the dark fringes on either side of the central bright fringe and divide that distance by two. From the measurements of y, W and L, and their uncertainties, what is the wavelength of the light? Repeat the process of estimating wavelength for slits of width (W = 0.080 ± 0.005 mm) , (W = 0.040 ± 0.005 mm) and (W = 0.020 ± 0.005 mm). Show all of your work. Comment also: as the slit gets narrower, what happens to the diffraction pattern?
- Repeat Part A for different colour lasers, if you have them.
Second, you will use a diffraction pattern to determine the width of a hair. Surprisingly, a narrow barrier will produce the same pattern as a narrow opening of the same width. This is an interesting principle called "Babinet's Principle" (en.wikipedia.org/wiki/Babinet's_principle).
Set-up: You'll need to still use the screen and laser that are mounted on the track. The lens holder is a rectangular sheet of metal with a small hole, as shown below. You should tape the hair onto the lens holder as shown in the picture. The lens holder has a special mount - to attach, just slide the lens holder into the top of the mount and then snap the mount onto the track. See the pictures below:
Lens holder: 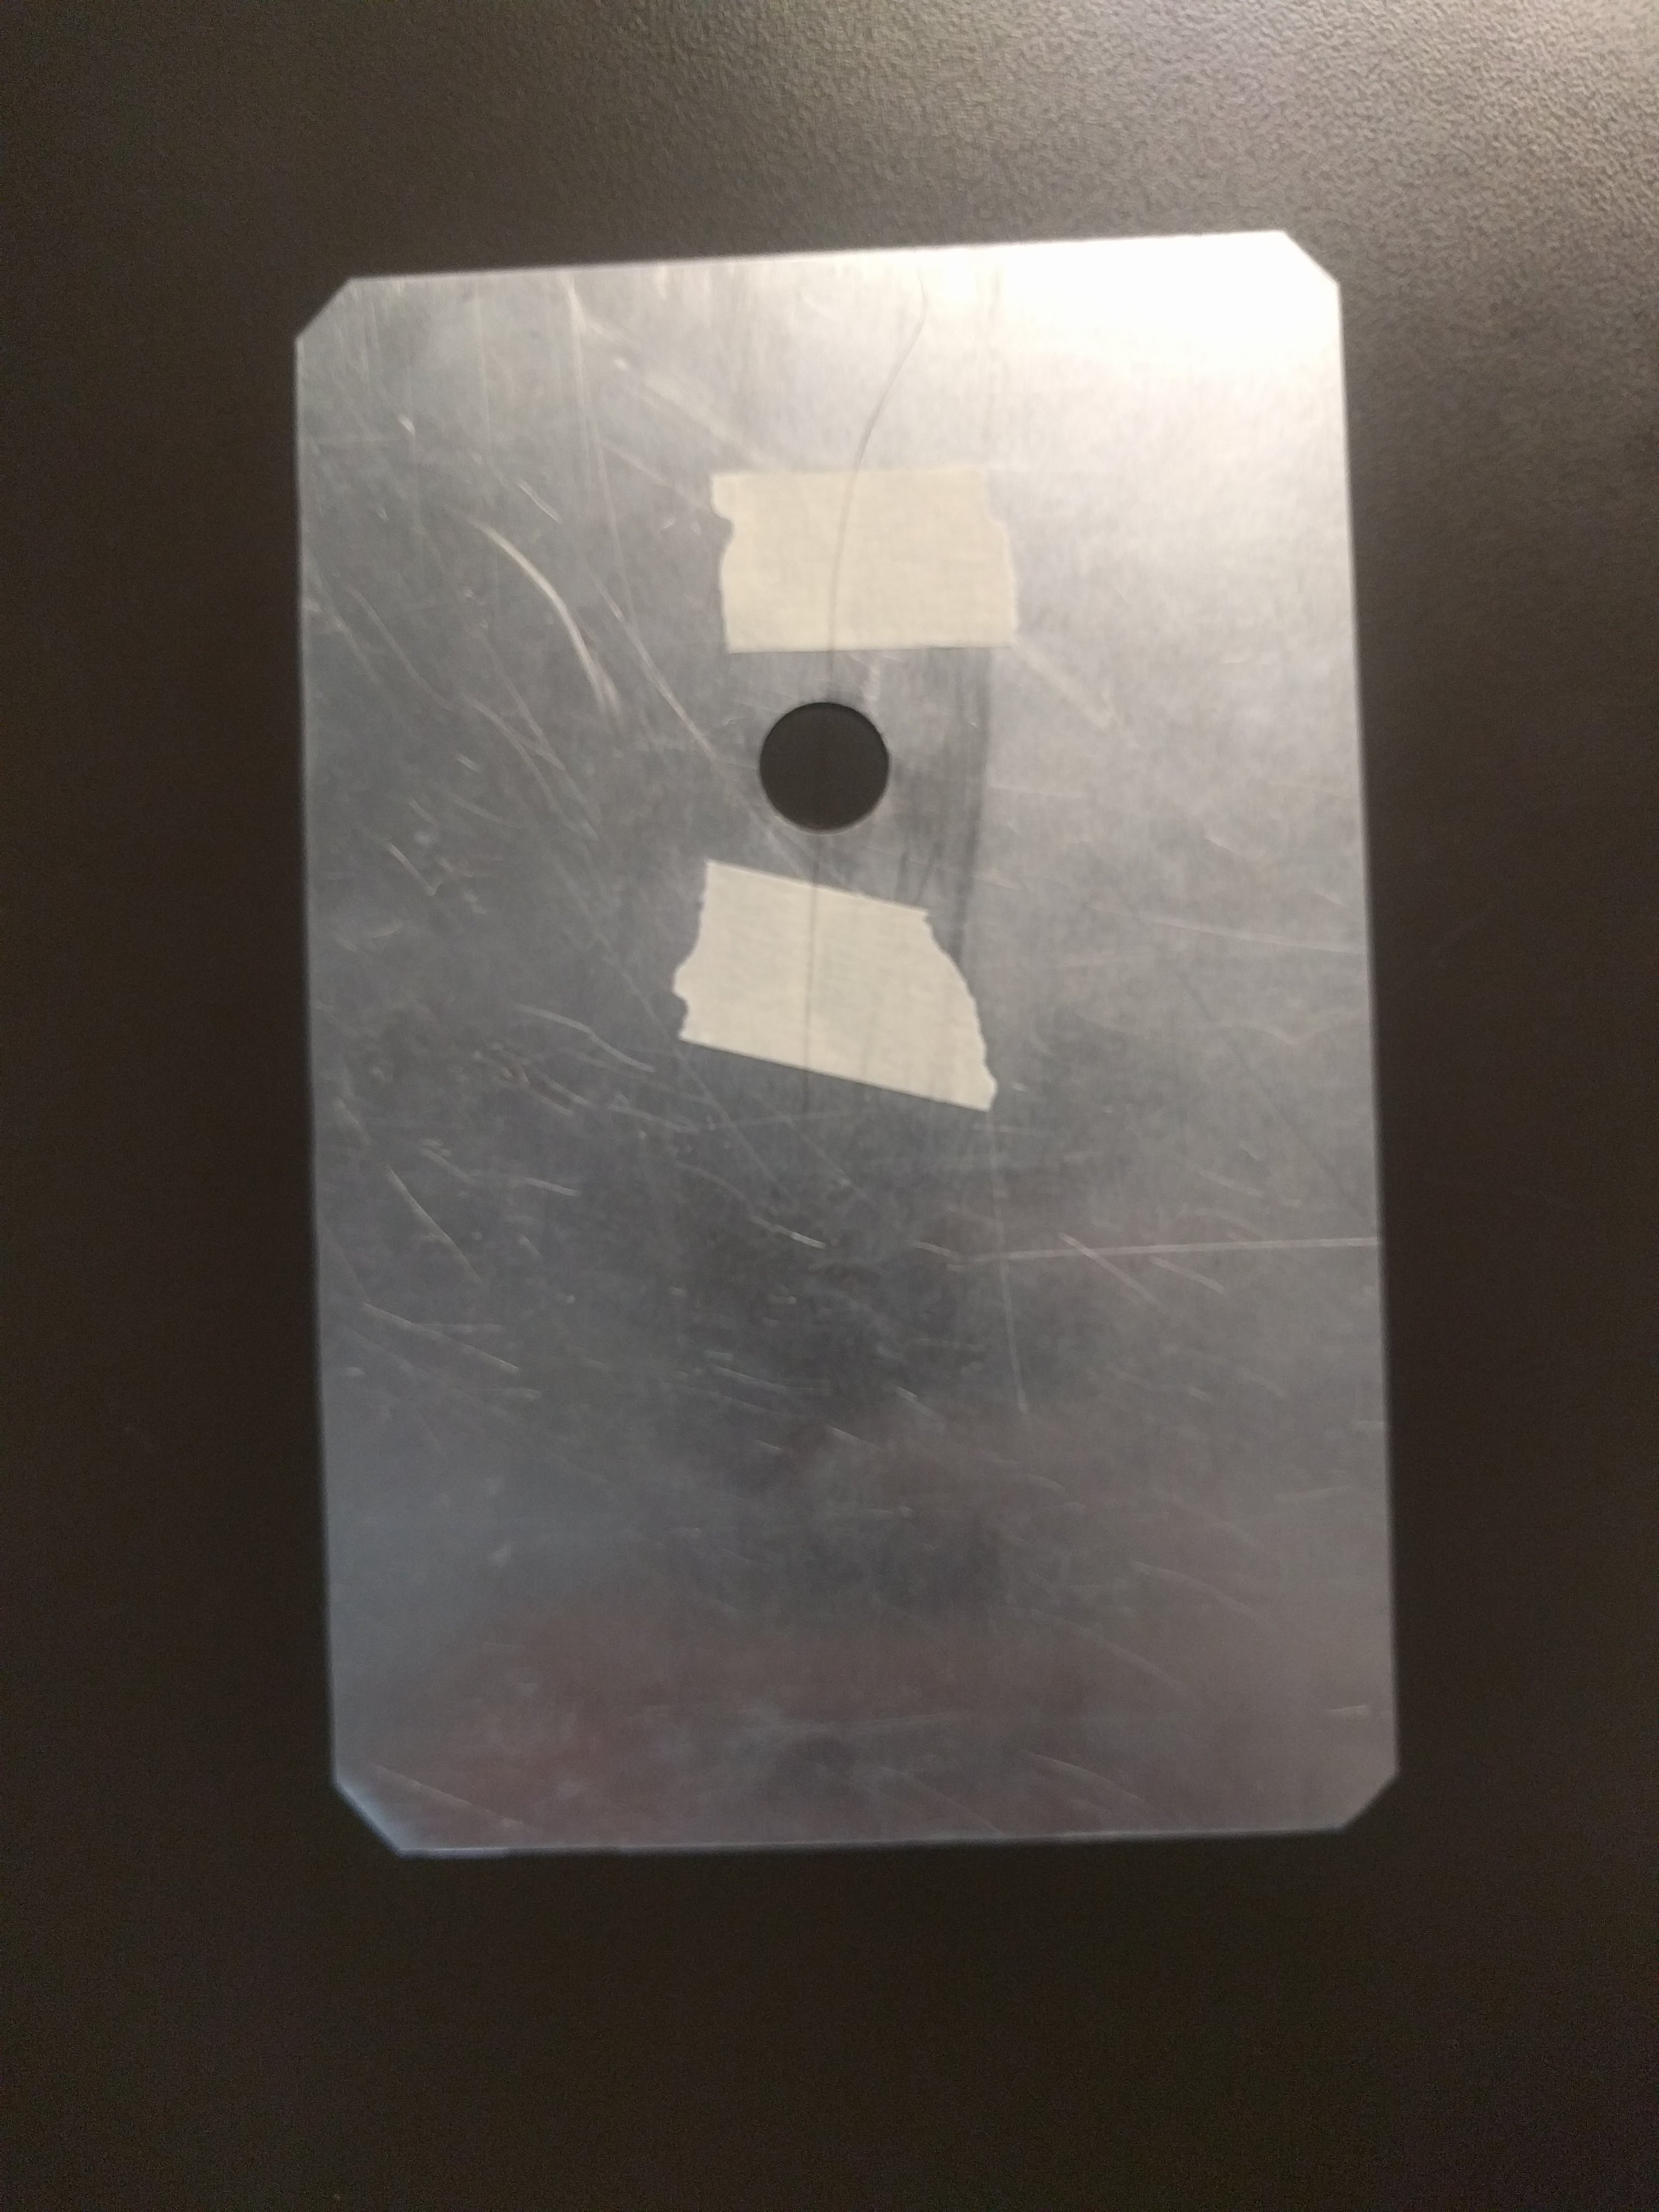 Lens holder mounted on track:
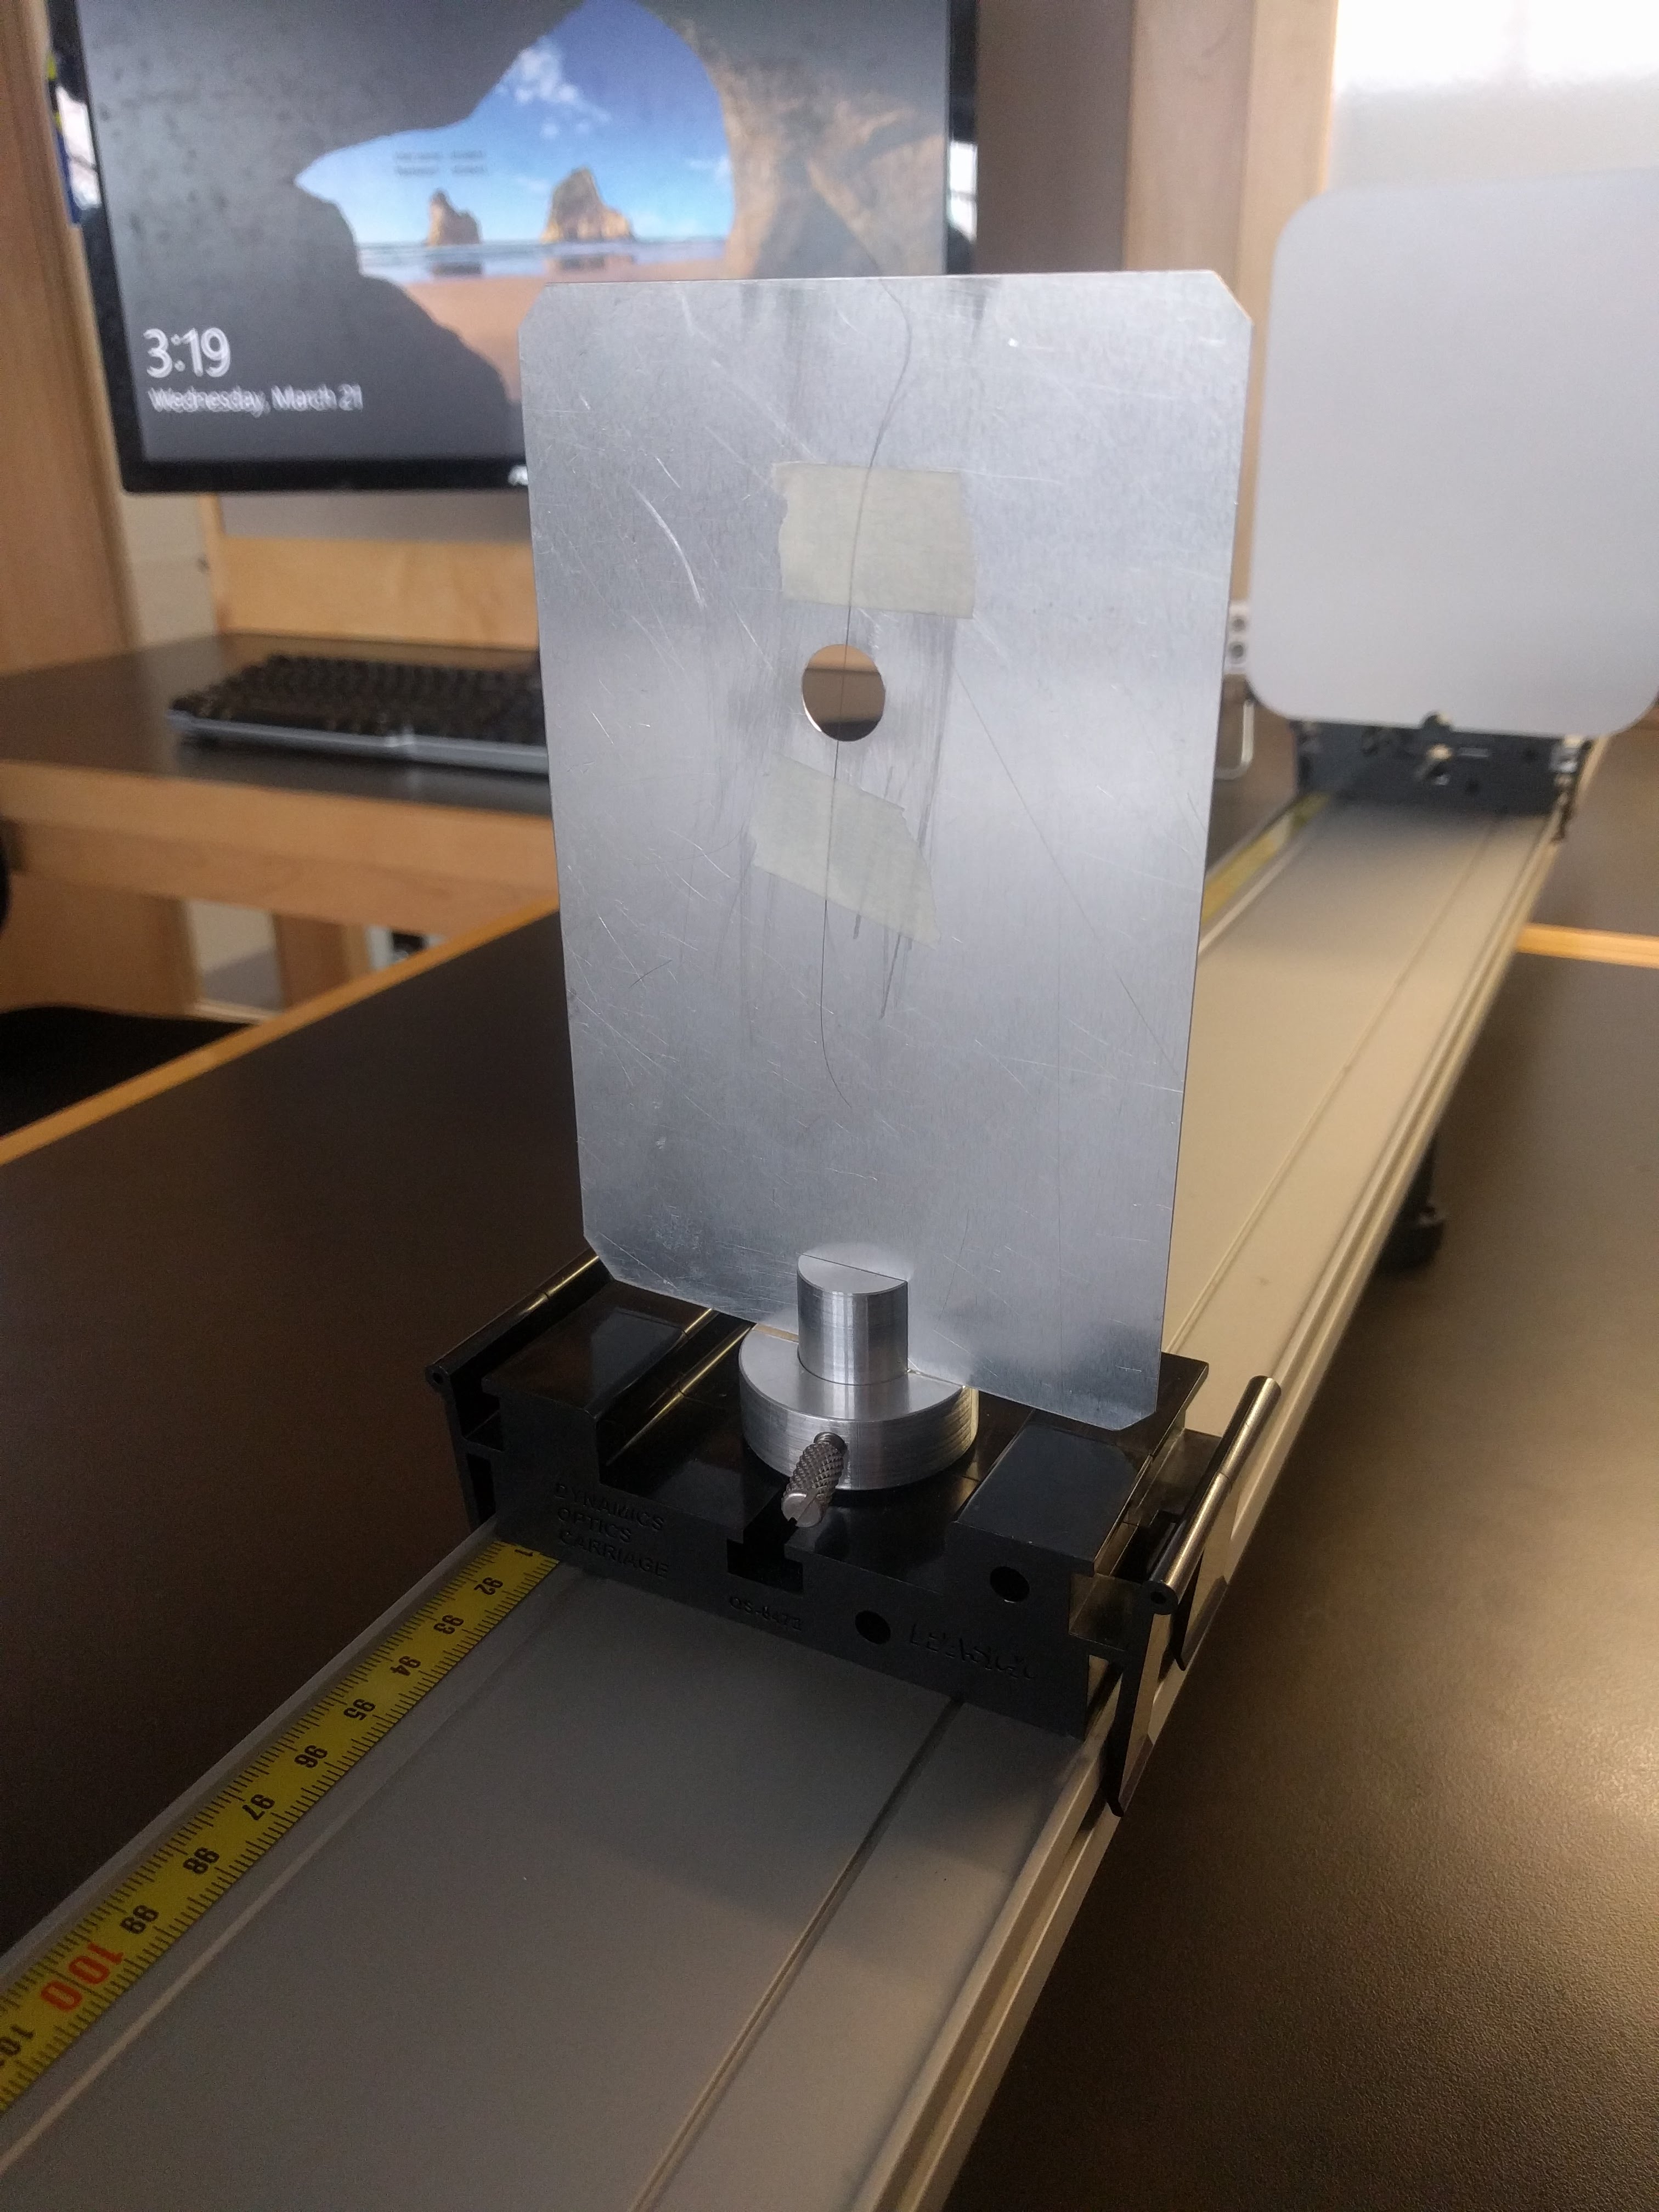
- Take a hair from someone in your group. Stretch the hair and tape it down onto the metal lens holder. Mount the holder onto the track. Position the laser so that it shines on the hair and creates a pattern similar to what you saw for a narrow slit. Tape a piece of paper to the screen and sketch the pattern that appears on the screen. This sketch can be taped into your notebook. Mark the middle of the pattern. How does the width of the central bright fringe compare to the widths of the other bright fringes?
- Measure L, the distance between the hair and the screen. Determine the distance (y) between the middle of the central bright fringe and the middle of the first dark fringe on one side of the pattern (as shown in the diagram above). It is easier to measure the distance between the centers for the dark fringes on either side of the central bright fringe and divide that distance by two. Using the reported wavelength of the laser, calculate the width of the hair. Some internet research suggests that typical human hair diameters range from about 50 to 100 \(\mu {\rm m}\). Is your measurement consistent with this range?
Activity 6: The Double-Slit
When laser light passes through a double slit, the interference pattern consists of bright fringes of equal widths. The difference in the distances from the two openings to a spot at an angle \(\theta\)off center is \(d \sin \theta\), where d is the separation between the slits. The centers of the bright fringes are located at angles where this difference is \(0,\ \lambda,\ 2\lambda,\) etc. (constructive interference) and the centers of the dark fringes are located at angles where the path difference is \(\lambda/2,\ 3\lambda/2,\ 5\lambda/2,\) etc. (destructive interference). These two conditions give:
bright fringes: \(\sin \theta_m = m \lambda / d \quad \quad m = 0, 1, 2, ...\)
dark fringes: \(\sin \theta_m = (m + \frac{1}{2}) \lambda / d \quad \quad m = 0, 1, 2, ...\)
The brightness of the pattern varies because of the width of the individual slits.
You will use an interference pattern to determine the distance between the two narrow slits.
-
Set up the red laser to pass through a pair of narrow slits with a separation of 0.250 mm (either slit width is fine). The screen should be as far away as possible. Sketch the pattern that appears on the screen. Mark the middle of the pattern. (Note: Concentrate on the finer pattern which is due to the interference of light from the two slits.) How does the width of the central bright fringe compare with the widths of the other bright fringes? How does the brightness of the fringes vary?
-
Measure the distance, L, between the slits and the screen.
-
Measure the distances (y) between the middle of the central bright fringe and the middles of the next three bright fringes in the pattern. These measurements could go into the second column of a table such as the one below.
| Bright Fringe | y = Distance to bright fringe (m) | \(\theta\) = Angle to bright fringe (rad) | \(d_{\rm exp} \) = slit separation (m) |
| 1st | |||
| 2nd | |||
| 3rd |
- For each bright fringe, calculate the angle from the middle of the central bright fringe. (Hint: Sketching what you measured will be helpful.) Enter the results in the third column of the table. Note that for small angles measured in radians, \(\sin \theta \approx \tan \theta \approx \theta\). This can be useful particularly when determining the uncertainty in \(\theta\) from your estimated uncertainty in y and L. Show your first calculation.
- Somewhere on the laser it should say what its wavelength is supposed to be. For each bright fringe, use this reported wavelength and your measurements to calculate the “experimental” separation ( \(d_{\rm exp} \) ) between the slits and enter the results in the fourth column of the table.
- Calculate the average of the experimental separation between the slits found in step 5. If all the measurements of \(d_{\rm exp} \) have the same uncertainty, \(u(d_{\rm exp})\), then the uncertainty in the average of N independent measurements should be \(u(d_{\rm exp})/\sqrt{N}\) How does the average experimental slit separation compare to the value written on the slide (note, compare against the appropriate “slit separation”)? Are your measurements consistent with the reported value?
- Qualitatively, how do you expect the double-slit interference pattern to change if a green laser (\(\lambda\) = 540 nm) is used instead of a red laser? Assume everything else about the setup remains the same. Explain your reasoning.
This module was written by Jason Harlow and Andrew Meyertholen in May 2016. Activities 1-4 are adapted from "Tutorials in Introductory Physics" 1st edition by Lillian C. McDermott, Peter S. Shaffer and the Physics Education Group, Department of Physics, University of Washington (C)2002 by Prentice-Hall, Inc.